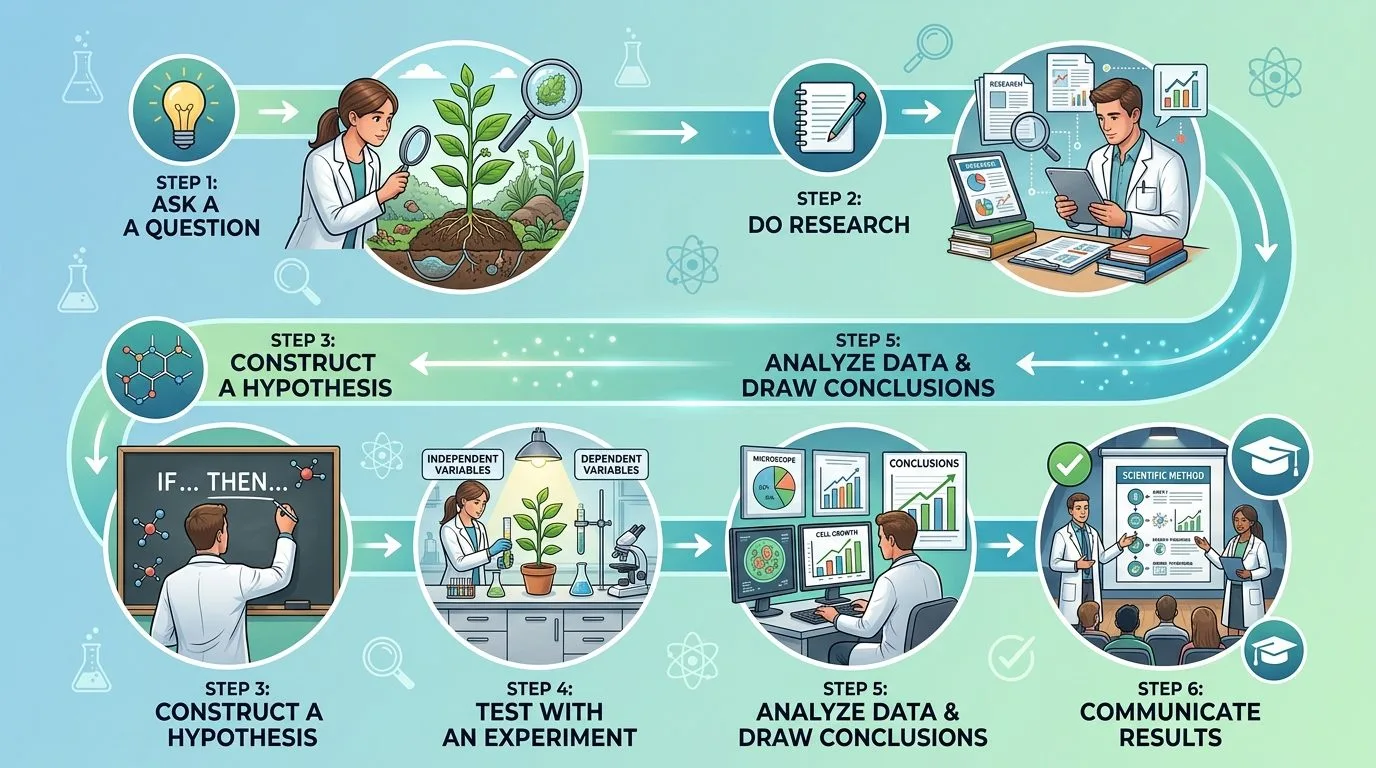
How do you design a fair science experiment? Start with one clear question, choose the factor you will deliberately change, decide what outcome to measure, and keep other relevant conditions comparable. Then specify a repeatable procedure, collect measurements from enough trials, and interpret the results—including uncertainty and possible alternative explanations. A fair test is designed so that a difference in results can reasonably be linked to the factor being investigated, rather than an unnoticed change in equipment, timing, materials or treatment.
For beginners, the most useful rule is change one independent variable at a time and control other relevant variables. This is not an absolute rule for all scientific research: advanced factorial experiments can deliberately vary more than one factor, while astronomy, ecology and many other fields use observational designs. The important principle is to plan a comparison that can answer the actual research question. The Science Buddies variable guide , the Royal Society of Chemistry's teaching guidance and the Next Generation Science Standards explain this approach.
This guide walks through designing a fair science experiment from question to report. It includes a toy-car ramp investigation, sample results that are explicitly hypothetical, ready-to-use planning sheets, troubleshooting examples and questions for students or teachers.
What makes a science experiment fair?
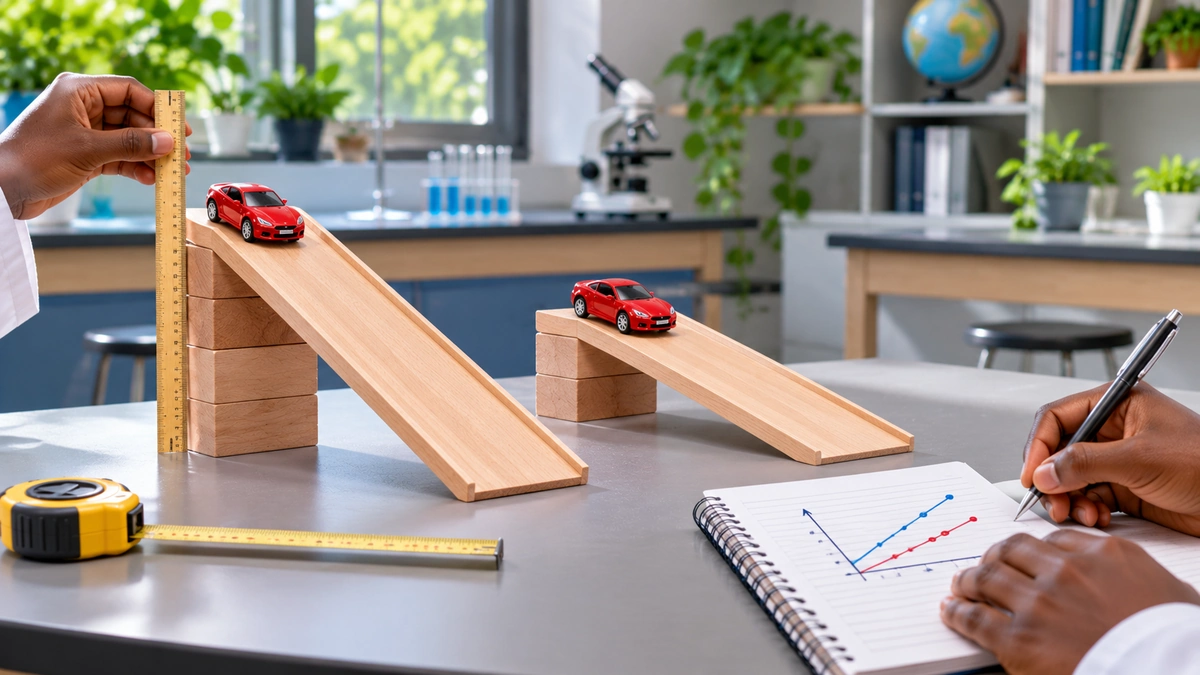
A fair experiment compares conditions in a way that reduces other explanations for the result. Suppose you want to find out whether changing the height of a ramp affects how far a toy car rolls after leaving it. If you use a heavier car for the high ramp, a smoother floor for the low ramp and a push in only one condition, you will not know what caused any difference. A fairer test uses the same car, ramp, release method, floor and measuring procedure while deliberately changing only the ramp height.
Fairness does not mean every result must be identical or every scientist will get the same number. Random variation, measurement limits and small differences in materials will still exist. A well-planned test minimises avoidable sources of bias and gives other investigators enough information to assess its reliability.
| Design element | Question to ask | What good planning looks like |
|---|---|---|
| Research question | What am I comparing? | Specific factor, outcome and context |
| Hypothesis | What relationship or explanation could be tested? | A statement that evidence could challenge |
| Independent variable | What will I deliberately change? | Defined levels, such as 10, 20 and 30 cm |
| Dependent variable | What result will I measure? | Distance in centimetres, with a clear start and finish |
| Controlled variables | What must stay comparable? | Same toy car, ramp, track, release and measuring system |
| Comparison condition | What provides a baseline? | A reference level or suitable control group |
| Repetition | How will I check variability? | Several independently released runs for each level |
| Analysis | How will I summarise and interpret? | Raw measurements, units, averages, spread and limitations |
Step 1: write a precise, answerable research question
“Which toy car is best?” is too vague. “Does raising the upper end of a fixed wooden ramp change the distance travelled by the same toy car across a level floor after the car leaves the ramp?” is more useful. It names the change, the outcome and the test setting.
A strong research question should identify the subject, the independent factor, the measurable response and any essential conditions. Examples include:
- How does the length of a paper helicopter's blades affect its fall time from the same safe release height?
- How does the number of layers of an otherwise identical fabric affect the amount of light passing through it?
- Does using two different brands of absorbent material alter the amount of water retained per equal-area sheet?
Be careful about the last example: if different brands also differ in thickness, the study compares their overall products. It does not isolate fibre composition on its own. This distinction between a product comparison and a narrower mechanism matters throughout experimental design.
Step 2: develop a testable hypothesis and a prediction
A hypothesis proposes an explanation or relationship that could be supported or challenged by evidence. A prediction states a particular outcome expected under specified test conditions. For the ramp activity:
Working hypothesis: Increasing the height of the raised end of an otherwise unchanged ramp will increase the distance travelled by the toy car after it reaches the floor, under the stated conditions.
Prediction: Across repeated releases, the mean floor-travel distance will be greater at 30 cm ramp height than at 20 cm, and greater at 20 cm than at 10 cm.
This wording does not imply the experiment can separate the effects of vertical height from every related physical change. Changing the height of one end of a fixed-length ramp also changes its angle. The experiment therefore tests the effect of the ramp configuration produced by raising the end, not an independently isolated effect of height versus angle. Making that limitation explicit is part of sound science.
Teachers may use “If…then…because…” sentences to help beginners form predictions, but no special phrase automatically makes a hypothesis scientific. It must identify a testable relationship or explanation. The Science Buddies guide and National Science Teaching Association place prediction in the context of purposeful inquiry.
Step 3: identify the independent, dependent and controlled variables
Independent variable: the factor you deliberately change
In a beginner's controlled investigation, the independent variable is the intended difference between conditions. Our example uses three levels for the vertical height of one end of the ramp: 10 cm, 20 cm and 30 cm. These must be measured from the same reference surface with the same ruler.
Dependent variable: the outcome you measure
The dependent variable is the result you observe or measure. Here it is the horizontal distance, in centimetres, that the toy car travels on the floor beyond the end of the ramp until it stops. Start each measurement from the same marked finish line at the foot of the ramp. Use a tape measure along the car's actual path and record distances using consistent precision.
Controlled variables: relevant conditions you keep comparable
Keep the same car, ramp, starting point on the ramp, release technique, floor surface, track alignment and measuring method. Do not secretly push the car in one condition. Use the same car wheels and check that they do not accumulate debris. The point is not that every imaginable condition must be perfectly identical, but that important alternative explanations are minimised and documented.
Confounding factors: alternative explanations
A confounder is another factor that changes with the independent variable and may help explain the result. For example, if taller ramp settings use a different ramp surface, travel distance could depend on both height and surface friction. The use of the same fixed ramp avoids that particular confounder, though ramp angle still changes naturally with height.
| Term | Ramp experiment | Why it matters |
|---|---|---|
| Independent variable | Height of raised ramp end (10, 20, 30 cm) | Defines the intended comparison |
| Dependent variable | Floor travel distance after leaving ramp (cm) | Defines the measured response |
| Controlled variables | Car, ramp, start mark, floor, release and measurement | Reduces competing explanations |
| Potential confounder | Different car or floor used at high setting | Could create a misleading apparent effect |
| Linked design change | Ramp angle changes as height changes | Limits claims about height independently of slope |
The Royal Society of Chemistry recommends specifying precisely how variables will be controlled, not simply stating “keep everything else the same”.
Step 4: decide whether you need a control group
Students often confuse controlled variables with a control group. They are different ideas. Controlled variables are features kept comparable across the study. A control group is a baseline condition used to evaluate a treatment or change.
In a seed-germination study testing a fertiliser, untreated seeds grown under the same conditions might serve as the control group. In a medicine trial, a suitable comparator might be standard care or a placebo, subject to ethical rules and clinical oversight. These are different from simply “controlling the temperature”.
Our toy-car investigation does not require an untreated group: 10 cm is a reference or baseline ramp setting against which higher settings can be compared. Calling it a “control group” would add confusion unless the design defines a meaningful treatment and untreated condition.
Some studies also use positive and negative controls to confirm that a test system is capable of producing a known response and does not produce a false signal without the target factor. They are useful when justified by the question but are not obligatory for every classroom experiment. NSTA's discussion of control conditions shows why an appropriate baseline helps interpret experimental outcomes.
Step 5: choose materials, sample size and a repeatable procedure
Make a complete equipment list before starting. A procedure should state quantities, dimensions, timing, units, the order of actions and the number of trials. Another student should be able to follow it without guessing what “use the same amount” or “roll it normally” means. The Science Buddies experimental-procedure guide emphasises exact steps and repetitions.
A few repetitions are better than a single attempt, but there is no universal sample number that guarantees a reliable result for every research question. The appropriate sample size depends on expected variation, effect size, available equipment and the precision needed. For this illustrative classroom activity, use five independent releases at each of three ramp settings to provide visible variation and simple averages. That is a teaching choice, not a statistically established sample-size requirement.
Where possible, vary or randomly select the order of conditions—rather than always testing 10, then 20, then 30 cm—so that changes in the floor, equipment or tester over time are less likely to favour one setting. If the setup makes full randomisation impractical, document the actual order and consider how it could affect results.
Worked classroom activity: does ramp height change how far a toy car travels?
Materials and safety
You need one small wheeled toy car, a rigid wooden or plastic ramp around 80 cm long, stable support blocks, a centimetre ruler, measuring tape, masking tape, a level indoor floor, a notebook and an optional smartphone camera for checking the release. Use the floor—not a tabletop—so the car cannot fall from a height. Keep the activity away from stairs, sockets, loose cables and walkways, and ensure the ramp cannot slip or collapse. Adult supervision is advisable for children.
Detailed experimental method
- Prepare the track. Position the ramp so that its lower end rests at a fixed line on the level floor. Mark where the toy car leaves the ramp and the position from which it will be released. The same ramp and car must be used throughout.
- Set the first height. Raise the far end using a stable block until it is 10 cm above the floor. Measure vertically, not along the ramp.
- Release without pushing. Place the car at the marked start point and release it with as little added force as possible. Avoid giving it a hand-powered shove.
- Measure the outcome. Once the car stops, measure from the fixed line at the ramp's foot to the car's final position on the floor. Record the distance in centimetres, plus any unusual movement or obstacle.
- Repeat independently. Reset the car and release it again until you have five runs. These are five releases, not five readings of the same final parked car.
- Test the other settings. Set the ramp's upper end to 20 cm and 30 cm and perform five releases per condition, keeping all other practical details as consistent as possible. Randomise the sequence of settings if the supports permit safe changes.
- Check the raw record. Verify units and the number of observations. Do not discard an unusual value without documenting a valid reason such as a collision or measurement failure.
- Summarise and explain. Calculate the mean distance for each height, compare patterns and identify which competing explanations the test can and cannot rule out.
Limitation: Even with the same car, ramp and floor, raising the ramp changes the gravitational energy available and the slope, as well as potentially changing the car's motion and the transition onto the floor. This test is suitable for investigating the whole configuration but does not independently estimate every underlying physical mechanism.
Step 6: record results without inventing or hiding observations
Prepare your results table before the first release and enter every valid trial as it occurs. Decide in advance how to record a car that hits a chair, leaves the track or is accidentally pushed. Such an event should be marked and, if appropriate, the trial repeated with the reason recorded—rather than quietly removed because it conflicts with the hypothesis.
The table below is a fictional dataset created solely to demonstrate analysis. It is not an experiment conducted for this article and should not be presented as real experimental results.
| Trial | 10 cm height | 20 cm height | 30 cm height |
|---|---|---|---|
| 1 | 60 cm | 107 cm | 147 cm |
| 2 | 63 cm | 110 cm | 151 cm |
| 3 | 61 cm | 112 cm | 149 cm |
| 4 | 62 cm | 109 cm | 150 cm |
| 5 | 64 cm | 112 cm | 153 cm |
| Mean distance | 62 cm | 110 cm | 150 cm |
For the 10 cm setting, the example mean is (60 + 63 + 61 + 62 + 64) ÷ 5 = 62 cm. For 20 cm, it is 550 ÷ 5 = 110 cm; for 30 cm, 750 ÷ 5 = 150 cm. The individual values are close to their group means in this invented example, but actual student measurements may vary much more.
The hypothetical results show a rising pattern in average distance as the upper ramp height increases. They would be consistent with the prediction under these conditions, but do not establish a universal numerical rule or prove the outcome for every toy car and ramp.
Step 7: analyse distance, variation and uncertainty
Calculate averages and show the individual observations
A mean summarises the centre of the measurements, but five numbers may vary in ways that the mean conceals. Report the individual trial data as well, and consider the range or other measure of spread. In the example above, the distances at 10 cm range from 60 to 64 cm; at 20 cm from 107 to 112 cm; at 30 cm from 147 to 153 cm.
Choose a graph that fits your question
For a graph, put ramp height (cm) on the horizontal axis and car travel distance on the floor (cm) on the vertical axis. Plot the mean for each of the three height levels, and, where possible, show individual trial points or error bars that are clearly defined. A line between means may help visualise the ordered levels, but three points do not justify claims about the exact curve at untested heights.
Recognise precision limits
A measuring tape may have millimetre markings, but deciding precisely where the car stopped and whether it bounced or veered sideways can be more uncertain than the tape itself. More decimal places do not eliminate that uncertainty. Define the end point consistently and record measurements to a realistic precision.
Separate difference from certainty
A larger mean does not automatically show that a result is scientifically robust. Assess the variation, the number of independent runs, the procedure and whether unexpected effects could explain the observations. Formal hypothesis testing may be appropriate for some advanced projects, but statistical significance is not the same as practical importance, and a small classroom example cannot support sweeping causal claims.
The National Academies' reproducibility report explains why transparency about methods, uncertainty and independent testing matters in science.
Step 8: write a conclusion that does not overclaim
A strong conclusion includes four elements: the question, the observed result, its relevance to the hypothesis, and its limitations. For the fictional ramp dataset, a suitable example is:
Under the illustrated conditions, mean floor-travel distance increased from 62 cm at a 10 cm ramp setting to 110 cm at 20 cm and 150 cm at 30 cm. These hypothetical measurements are consistent with the prediction that raising the ramp's upper end increases the distance travelled. However, the example includes only five trials per setting, and ramp angle changes alongside height. Real experiments and additional tests would be needed to assess how broadly the pattern applies.
A conclusion should never say that a hypothesis was “proven” by one small experiment. Results may support or weaken an explanation, and subsequent studies may reveal limitations, measurement errors or better hypotheses.
Accuracy, reliability and validity in a fair test
Accuracy means measuring close to the true value; precision concerns how closely repeated readings agree. A ruler with a consistent offset can be precise but inaccurate. Reliability is improved when comparable tests yield reasonably consistent results, while validity asks whether the procedure really answers the proposed question. In the ramp experiment, measure the floor distance consistently, record trial-to-trial variation and avoid claiming that a change in ramp height was separated from its simultaneous change in slope. Repeatability and independent replication add confidence without guaranteeing identical numbers. See the National Academies' reproducibility and replicability review .
Why repetition, randomisation and bias matter
Repetition shows whether measurements vary between independent attempts: five car releases are more informative than five readings of one run. But one car on one ramp does not represent every car or ramp. Randomising the order of conditions can limit time-related bias, such as dirty wheels affecting the last trials. Observer bias occurs when expectations influence measurement or selective reporting. Decide how to measure before the test, record all observations, and document justified exclusions. Where practical, have another person check readings. These measures support transparent investigation; see NOAA's research-integrity guidance .
Three more fair science experiment examples
Example A: does paper-helicopter blade length affect fall time?
Use paper helicopters cut from the same paper with a standard pattern. Change blade length deliberately, measure descent time from the same safe, indoor release height and keep release method and air conditions consistent. Watch for a key design challenge: changing blade length may also change paper mass or total surface area, so interpret the result as a comparison between the chosen design configurations unless the factors are separated more carefully. A video recording may reduce reaction-time error.
Example B: does fabric layering change light transmission?
Stack one, two or three identical pieces of fabric between a low-power battery-powered light source and a light meter or suitable sensor. Measure light intensity at a fixed distance, with the same fabric type, ambient lighting and positioning. Avoid looking directly into intense light sources or lasers. As layers increase, both thickness and total material quantity change as the defined intervention.
Example C: does water amount affect seed germination?
Place similar seeds into identical labelled containers and apply specified water volumes. Keep species, number of seeds, growth medium, light, temperature and duration comparable. Measure how many germinate using a consistent definition of germination. Use multiple containers per condition: ten seeds in one pot do not necessarily count as ten independent containers, because they share the same microenvironment. Avoid mould exposure, and follow school hygiene procedures.
When is a fair test not the right kind of investigation?
Astronomers cannot reposition stars, and geologists cannot recreate the planet's past. Some questions are better investigated through observation, modelling and comparisons that account for alternative explanations. For example, SuperEducational's guide to mapping valleys beneath Greenland's ice explains how researchers draw conclusions using measurements of inaccessible environments. Advanced experiments may intentionally vary multiple factors and use appropriate analyses to separate their effects. Thus, “change one factor” is a useful beginner rule, not a definition of all science. See the National Research Council's framework .
Fair test mistakes and how to fix them
| Problem | How it distorts the study | Better design |
|---|---|---|
| Using different cars at different heights | Mass, wheels and friction differ | Use the same car for every condition |
| Pushing the car by hand inconsistently | Adds an uncontrolled force | Release from a fixed mark without a shove |
| Changing floor surfaces between trials | Alters rolling resistance | Use one fixed, level, unobstructed track |
| Only one run per height | Cannot reveal run-to-run variation | Repeat independent releases |
| Not defining the distance endpoint | Results become incomparable | Measure from a marked ramp exit to final car position |
| Deleting inconvenient readings | Introduces selection bias | Preserve all observations and record justified exclusions |
| Using an unsafe high platform | Creates unnecessary risk | Keep the ramp and car on the floor |
| Claiming to isolate height from angle | Overstates what the apparatus can determine | Describe the combined ramp-configuration change |
Printable fair science experiment planning worksheet
Teachers can copy or print this planning template before students begin. A learner should be able to complete it before any results are known.
| Planning question | Your answer |
|---|---|
| Experiment title | ________________________ |
| Research question | ________________________ |
| Hypothesis and reason | ________________________ |
| Prediction | ________________________ |
| Independent variable and its levels | ________________________ |
| Dependent variable and measurement units | ________________________ |
| Controlled variables (with actual settings) | ________________________ |
| Comparison or control condition | ________________________ |
| Materials and equipment | ________________________ |
| Number and order of trials | ________________________ |
| Measurement method and precision | ________________________ |
| Safety or ethical risks and precautions | ________________________ |
| How results will be recorded | ________________________ |
| Possible confounders | ________________________ |
| Expected limitations | ________________________ |
Once the experiment is complete, add a separate results table, graph, conclusion and reflection. Do not rewrite the original prediction to match what happened. That separation between planning and analysis strengthens transparency.
Frequently asked questions
What are the main steps in designing a fair science experiment?
Define the question, develop a testable hypothesis, identify independent and dependent variables, control relevant conditions, select an appropriate comparison, plan repeated measurements, carry out the procedure safely, analyse all the observations and report a qualified conclusion.
Does a fair test have to change only one variable?
For many introductory classroom experiments, deliberately changing one main independent variable makes interpretation easier. Advanced experimental designs may vary several factors intentionally, provided the design and analysis can separate their effects.
What is the difference between a controlled variable and a control group?
A controlled variable is a condition kept comparable, such as the car or floor used in every trial. A control group is a defined reference or untreated condition used to evaluate an intervention when the research question requires one.
How many trials do you need?
There is no magic number for every study. Multiple independent trials help describe variation, but the necessary number depends on the question, expected spread, effect size, measurement quality and available resources. For a beginner project, several trials per condition provide a useful starting point.
Can you perform a fair test without a hypothesis?
Exploratory investigations can collect useful data without a fixed explanatory hypothesis. If a class is testing a stated hypothesis, however, define it and its predicted outcomes before collecting the data to avoid presenting a post-hoc idea as a pre-planned prediction.
What if results do not agree with the prediction?
Keep the data, check for procedural problems, consider alternative explanations and refine the next experiment. A result that does not support your idea can still be scientifically valuable.
How do you write a fair test conclusion?
Answer the research question using actual measurements, explain whether the pattern is consistent with the hypothesis, note uncertainty and confounders, and avoid claiming more than the method can establish.
Conclusion: fairness means making comparisons you can defend
To design a fair science experiment, you need more than a catchy hypothesis or an attractive results chart. You must define what changes, explain what is measured, hold relevant conditions comparable, repeat the test, document uncertainty and interpret the evidence honestly. A control condition is useful when it fits the question; controlled variables are essential to many fair comparisons; and potential confounders should be acknowledged rather than hidden.
The toy-car ramp demonstration shows both the strengths and limits of a simple design. With the same car, floor, ramp and release method, students can examine how three ramp settings relate to distance. They should also recognise that raising the ramp changes its angle, so the study does not isolate every physical mechanism. That ability to say what your experiment shows—and what it does not is the foundation of sound scientific reasoning.
References and further reading
- Science Buddies — What Are Variables?
- Science Buddies — Preparing Experimental Procedures for a Science Fair Project
- Science Buddies — Conducting the Experiment
- Royal Society of Chemistry — How to Teach Controlled Variable Investigations at 11–14
- National Academies — Next Generation Science Standards: Planning and Carrying Out Investigations
- National Research Council — A Framework for K–12 Science Education: Scientific and Engineering Practices
- National Science Teaching Association — Doing Science
- National Science Teaching Association — Defending the Dependent Variable
- National Academies — Reproducibility and Replicability in Science
- NOAA Scientific Integrity Commons — Research Design, Conduct and Data Management