Greenland looks like a vast white surface, but beneath its ice sheet lies a complicated landscape of mountains, ridges and valleys. Much of that bedrock has never been mapped directly at high resolution because the ice is kilometres thick.
Scientists therefore combine direct measurements with physics-based inference. One powerful approach is Ice Flow Perturbation Analysis (IFPA), which uses subtle variations in ice-surface elevation and velocity to infer features of the buried bed.
Why the bed beneath the ice matters
Bedrock topography helps control how an ice sheet moves. Valleys can channel faster flow, ridges can redirect it, and low areas can influence where subglacial water travels. Better maps therefore improve both geological reconstruction and ice-sheet modelling.
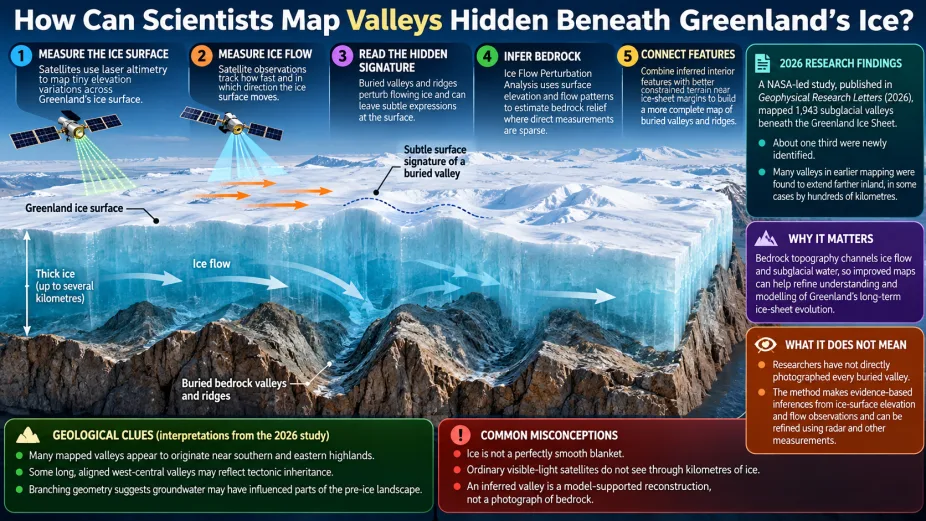
Step 1: measure the ice surface
Satellite altimeters can measure small changes in surface elevation across Greenland. The ice surface is not perfectly smooth: buried hills and valleys can leave faint expressions above because flowing ice responds to the shape of the bed below.
Step 2: measure ice-flow velocity
Satellite observations can also estimate how quickly the surface is moving and in which direction. Changes in bed shape influence stresses within the ice, which can alter surface velocity.
Step 3: read the hidden signature
A buried valley does not simply reproduce its shape at the surface. Ice deforms and flows, so the surface response depends on ice thickness, flow speed, basal conditions and other factors. Scientists therefore look for patterns that are consistent with bedrock features rather than treating surface bumps as direct photographs of the bed.
Step 4: invert the signal
IFPA uses a physical model of how bed perturbations are transferred through flowing ice. Researchers work backwards from observed surface elevation and velocity patterns to estimate the likely bedrock relief that produced them.
This is especially useful in areas where radar flight lines are sparse. Direct radar remains essential, but IFPA can help fill gaps between measurements.
Step 5: connect the landscape
Researchers then compare inferred interior valleys with better-constrained terrain near the margins, where the bed is more directly observed. Connecting these features can reveal valley networks that extend much farther inland than previous maps showed.
What the 2026 Greenland study found
A 2026 study in Geophysical Research Letters mapped 1,943 subglacial valleys beneath the Greenland Ice Sheet. About one third were newly identified, and many valleys already represented in earlier maps were extended farther inland—sometimes by hundreds of kilometres.
The work suggests that Greenland’s buried landscape is more connected and structurally complex than older maps implied.
What can the valley patterns tell us about geology?
Many valleys appear to radiate from highlands in southern and eastern Greenland. Some long, aligned valleys in west-central Greenland may preserve tectonic structure inherited from the underlying crust. Branching patterns in other areas could reflect groundwater erosion before the modern ice sheet covered the landscape.
These are interpretations, not certainties. The buried landscape records a long geological history, and multiple processes may have shaped it.
Why direct radar is still important
Radar sounding can penetrate ice and provide direct estimates of ice thickness and bed elevation along survey tracks. IFPA does not replace those measurements. Instead, it complements them by using surface observations to infer likely terrain where direct coverage is incomplete.
What are the main uncertainties?
The method depends on assumptions about how ice flows and how slippery the bed is. If those assumptions are wrong in a particular region, the inferred bed shape can also be wrong. Fine-scale features may be smoothed out, and some surface patterns can have more than one possible explanation.
For that reason, scientists compare IFPA reconstructions with radar and other independent data wherever possible.
Common misconceptions
“Satellites can see through Greenland’s ice in ordinary photographs.” No. Visible-light images show the surface. Bedrock is inferred using radar, altimetry, ice-flow measurements and physical modelling.
“An inferred valley is a direct image of the bed.” No. It is an evidence-based reconstruction with uncertainty.
“The ice surface is perfectly flat.” No. Subtle elevation and flow variations carry information about processes below.
“A better bed map tells us exactly how fast Greenland will melt.” No. Bed topography is one important input among many, including climate, ocean conditions, ice physics and subglacial hydrology.
Practical application
When you see a map of terrain beneath an ice sheet, ask how each area was measured. Some regions may be constrained by dense radar observations, while others rely more heavily on interpolation or model-based inference. The uncertainty is part of the science, not a flaw to hide.
Key takeaways
- Greenland hides a large network of valleys beneath kilometres of ice.
- Satellite measurements of surface elevation and velocity can reveal indirect signatures of buried terrain.
- IFPA uses ice-flow physics to infer likely bedrock features where direct measurements are sparse.
- Radar remains important for validation and refinement.
- Better bed maps can improve understanding of ice flow, subglacial water and Greenland’s geological history.
FAQs
How thick is Greenland’s ice?
Thickness varies greatly and reaches several kilometres in the interior.
Can hidden valleys affect sea-level projections?
Indirectly, yes. Bed shape influences ice flow, so improved topography can strengthen the models used to understand future ice-sheet behaviour.
Does IFPA work everywhere?
No method is equally reliable in every setting. Performance depends on data quality and how well model assumptions match local ice and basal conditions.