The human brain contains an extraordinary variety of cells. Neurons send and process signals, while several kinds of glial cells support, protect and regulate the neural environment. Even cells that look similar under a microscope can differ in the genes they use, the molecules they produce and how they respond to ageing or disease.
That creates a difficult research problem: how can scientists study millions of individual brain cells without treating the brain as one biological average?
A growing answer is the single-cell atlas. Using techniques such as single-nucleus RNA sequencing, researchers can measure gene activity in enormous numbers of individual cell nuclei and use computational methods to organise those measurements into cell types, subtypes and biological states.
Why brain atlases are becoming so detailed
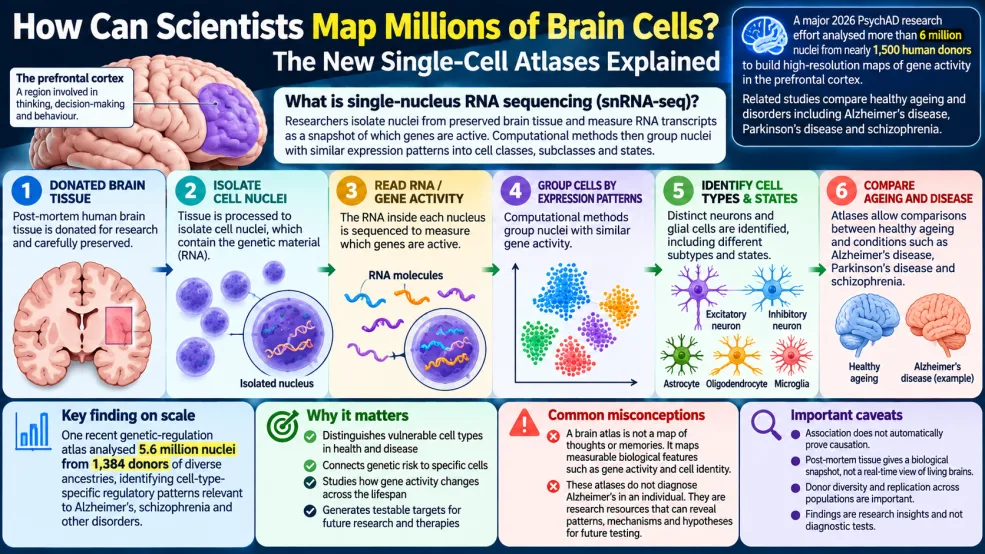
Recent large collaborative studies have moved from analysing thousands of cells to analysing millions of nuclei from donated human brain tissue. The PsychAD research programme, for example, has assembled high-resolution molecular information from the prefrontal cortex across large numbers of donors, enabling researchers to compare patterns associated with ageing and several neurological and psychiatric disorders.
A related multi-ancestry study analysed about 5.6 million nuclei from 1,384 donors to examine how genetic variation influences gene regulation in particular brain cell types. This scale matters because effects that disappear when millions of cells are averaged together can become visible when researchers ask what is happening in a specific cell population.
First: what is a cell nucleus?
Most human cells contain a nucleus that stores DNA. DNA contains genes, but not every gene is equally active in every cell. A neuron and a microglial cell contain broadly the same genome, yet they use different sets of genes to perform different jobs.
When a gene is active, its information can be transcribed into RNA. Measuring RNA molecules therefore gives researchers a useful snapshot of gene activity at the time the tissue was preserved.
What is single-nucleus RNA sequencing?
Single-nucleus RNA sequencing, often abbreviated to snRNA-seq, measures RNA associated with individual cell nuclei rather than blending RNA from a whole piece of tissue.
This approach is particularly valuable for preserved or frozen human brain samples, where isolating intact living cells can be difficult. Researchers can extract nuclei from tissue, capture individual nuclei and measure thousands of RNA transcripts from each one.
The result is not a conventional photograph. It is a very large dataset: rows may represent individual nuclei, columns may represent genes, and the values describe how much RNA associated with those genes was detected.
How scientists build a brain-cell atlas
1. Donated brain tissue is carefully characterised
Studies generally begin with donated post-mortem tissue. Researchers document factors such as brain region, donor age, biological and clinical information available to the study, tissue quality and experimental batch. Ethical consent and governance are essential because human tissue and associated data require careful handling.
2. Researchers isolate individual nuclei
The tissue is processed so that nuclei can be separated from surrounding cellular material. Laboratory methods then capture individual nuclei for molecular measurement.
3. RNA provides a snapshot of gene activity
Sequencing identifies RNA transcripts associated with each nucleus. Researchers use these measurements to estimate which genes were more or less active in that cell at the time represented by the sample.
This is an important distinction: sequencing is not reading a person's thoughts. It is measuring molecules.
4. Computers compare expression patterns
Millions of nuclei create a dataset far too large to interpret manually. Computational methods compare patterns across thousands of genes and place nuclei with similar molecular profiles near one another.
Clusters can then be investigated using known marker genes and other biological evidence. Researchers may classify broad groups such as excitatory neurons, inhibitory neurons, astrocytes, oligodendrocytes and microglia, followed by increasingly specific subclasses and states.
5. Researchers compare groups and conditions
Once cells have been classified, scientists can ask more focused questions. Which cell populations change with age? Which regulatory patterns are associated with genetic risk? Are particular neuronal or glial populations disproportionately altered in a disorder?
These comparisons can reveal patterns that would be diluted in a traditional bulk-tissue measurement.
What can researchers learn from these atlases?
Which cells may be especially vulnerable
If molecular changes repeatedly concentrate in particular cell types, researchers can investigate why those populations may be vulnerable or resilient. That can refine hypotheses about disease mechanisms.
Where genetic risk may act
Many disease-associated genetic variants do not directly change the structure of a protein. Instead, they can influence when, where or how strongly genes are regulated. Cell-resolved atlases help researchers connect genetic variation to regulatory activity in specific cell populations.
How the brain changes across the lifespan
By comparing samples from different ages, researchers can examine how gene activity and cell states change from development through adulthood and later life. These data can help distinguish patterns of ordinary ageing from patterns associated with disease, although the distinction is rarely simple.
Where future experiments should look
An atlas is often a starting point rather than an endpoint. It can identify a cell type, pathway or regulatory mechanism worth testing in laboratory models, longitudinal studies or other independent datasets.
What these brain atlases cannot tell us
Large datasets can sound more definitive than they really are. Several limitations are important.
Association is not automatically causation
If a molecular pattern is more common in people who had a particular disorder, that does not prove the pattern caused the disorder. It might be a consequence of disease, treatment, ageing, another biological process or a combination of factors.
Post-mortem tissue is a snapshot
Researchers cannot watch the same person's brain cells progress through decades using post-mortem samples. Instead, they compare tissue donated by different people. Study design and statistical methods can reveal important patterns, but the data are not a real-time film of disease progression.
RNA is only one layer of biology
Gene expression is informative, but cells are also shaped by proteins, epigenetic regulation, metabolism, connectivity, electrical activity and their surrounding environment. No single molecular technique captures the whole brain.
Representation matters
Human genetic variation and environmental histories differ across populations. Atlases built from more diverse donor groups can test whether observations generalise beyond the populations in which they were first discovered. Replication in independent datasets remains essential.
Common misconceptions
“A brain atlas maps people's thoughts or memories.”
No. These atlases map measurable biological characteristics such as gene activity, cell identity and regulatory patterns. They do not reconstruct a donor's thoughts, memories or personality.
“Scientists have found the Alzheimer's cell.”
Complex disorders do not generally reduce to one cell type or one gene. Researchers study interacting patterns involving many cell populations, genes, pathways and environmental factors.
“A six-million-cell dataset can diagnose an individual.”
No. These atlases are research resources, not individual diagnostic tests. Their purpose is to reveal population-level patterns and generate biological hypotheses that require further testing.
“Every cluster discovered by an algorithm is automatically a new cell type.”
No. Computational clusters must be interpreted using marker genes, biological knowledge, reproducibility and often additional experimental evidence. Analytical choices can influence how finely cells are divided into groups.
A simple example
Imagine a school with 10,000 pupils. If you calculate only the average mark for the entire school, you may miss important differences between year groups, subjects or learning needs.
Bulk brain-tissue measurements can face a similar problem: averaging many different cells may conceal cell-specific signals. Single-nucleus measurements are more like examining individual records and then grouping them by meaningful characteristics. The analogy is imperfect, but it explains why greater resolution can reveal patterns hidden by averages.
Why the prefrontal cortex?
The prefrontal cortex is involved in complex functions including planning, decision-making, working memory and aspects of behaviour. It is also affected in several neurological and psychiatric conditions. Studying this region across many donors therefore offers opportunities to compare molecular patterns across normal ageing and disease-related states.
How should readers interpret headlines about brain-cell maps?
When a new atlas is reported, ask several questions. How many donors were included, not merely how many cells? Were donors sufficiently diverse for the claim being made? Was the result replicated? Does the study report an association or demonstrate a causal mechanism? Is the finding based on one brain region or several? And are the authors describing a research hypothesis rather than a clinical test?
Those questions help distinguish a genuinely powerful research resource from an exaggerated claim about what the data can prove.
Key takeaways
- Single-nucleus RNA sequencing measures RNA associated with individual cell nuclei, giving researchers a snapshot of gene activity.
- Computational methods can group millions of nuclei into cell classes, subclasses and biological states.
- Large brain atlases can connect genetic regulation and disease-associated patterns to specific cell populations.
- Post-mortem atlases are snapshots and cannot by themselves prove that an observed molecular difference causes a disease.
- These resources are designed for research; they do not read thoughts or diagnose an individual person.
- Donor diversity, replication and integration with other biological measurements are essential for robust conclusions.
Frequently asked questions
Why sequence nuclei instead of whole cells?
Nuclei can often be recovered from frozen or preserved brain tissue even when intact cells cannot. That makes single-nucleus approaches particularly useful for large human post-mortem collections.
Does every nucleus contain the same DNA?
Most cells in one person contain broadly the same inherited genome, but different cell types activate different genes. There are also exceptions and acquired genetic changes, so the full biological picture is more complicated than identical DNA producing identical cells.
What is gene expression?
Gene expression describes the process by which information in DNA is used to produce functional molecules, often through RNA and then proteins. RNA measurements provide one way to estimate which genes are active.
Can a brain atlas lead to new treatments?
Potentially, but indirectly. Atlases can identify cell types, pathways and regulatory mechanisms worth investigating. Turning those observations into a safe and effective treatment requires additional experiments, validation, drug development and clinical trials.
Are larger datasets always better?
Scale helps, but study quality also depends on donor numbers and diversity, tissue quality, experimental design, measurement accuracy, statistical methods and independent replication. Millions of cells from too few or unrepresentative donors would not answer every question.
Authoritative references
- Nature Neuroscience — PsychAD: a single-cell atlas of the human prefrontal cortex across brain disorders
- Nature Genetics — Multi-ancestry single-nucleus atlas of genetic regulation in the human brain
- Nature — Human prefrontal cortex cellular and molecular changes across the lifespan
This article explains research methods and findings for educational purposes. It is not a diagnostic guide or medical advice.